2024
Data-Driven Ping-Pong Game Reconstruction
In this project, I analyzed accelerometer data from two mobile devices to reconstruct a Ping-Pong game. The main objective was to resample, align the data, detect impact events, and visualize the distribution of impacts on a Ping-Pong table model. I used X, Y, and Z acceleration data to pinpoint the location and timing of ball-table impacts.
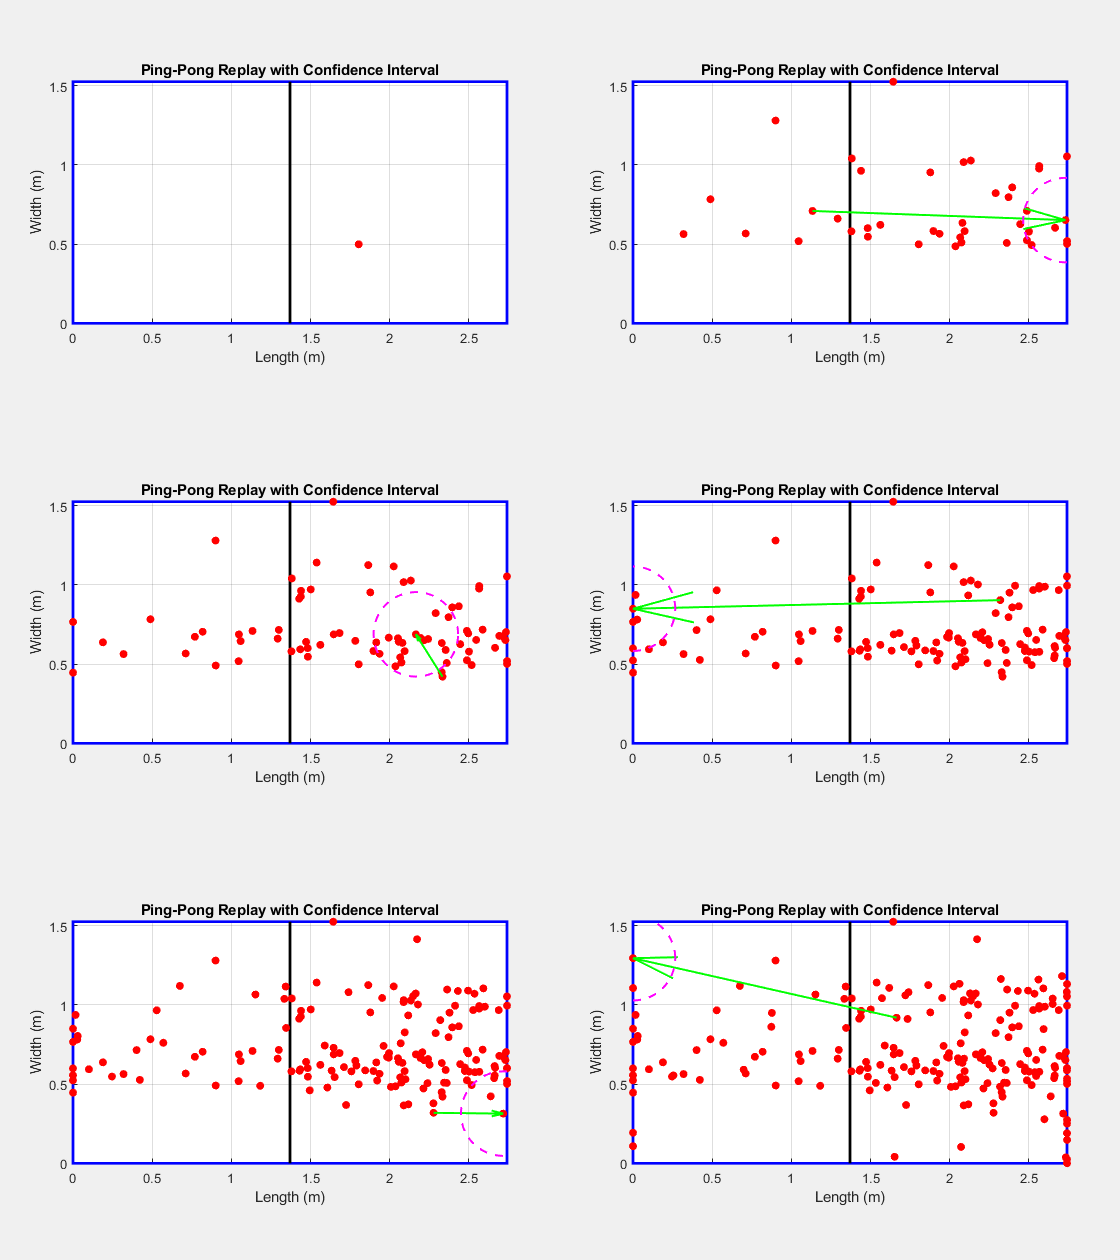
All rights reserved!
1. Methods
1.1 Data Extraction
I processed accelerometer data from the two devices, stored in matlab.mat files. The devices were placed in different corners of the table, which caused the vibration caused by the ball imoact to reach them at slightly different times. The data contains time and linear acceleration readings along three axes (X, Y, Z). I extracted this data to arrays for further analysis:
Phone1Array = table2array(Phone1);
Phone2Array = table2array(Phone2);
This allowed me to separate the X, Y, and Z acceleration data for both devices and prepare for impact detection. The main assumption was that the ball has the highest impact on the table vibration, and this vibration is highly affected by the impact location and direction vector of the ball.
1.2 Impact Location Detection Using X, Y, and Z Acceleration
The primary goal was to detect impact events based on sharp changes in acceleration along the Z-axis, which would indicate a collision between the ball and the table. However, I also considered changes in the X and Y axes to refine the detection of the ball's trajectory and calculate the approximate location of the impact on the table.
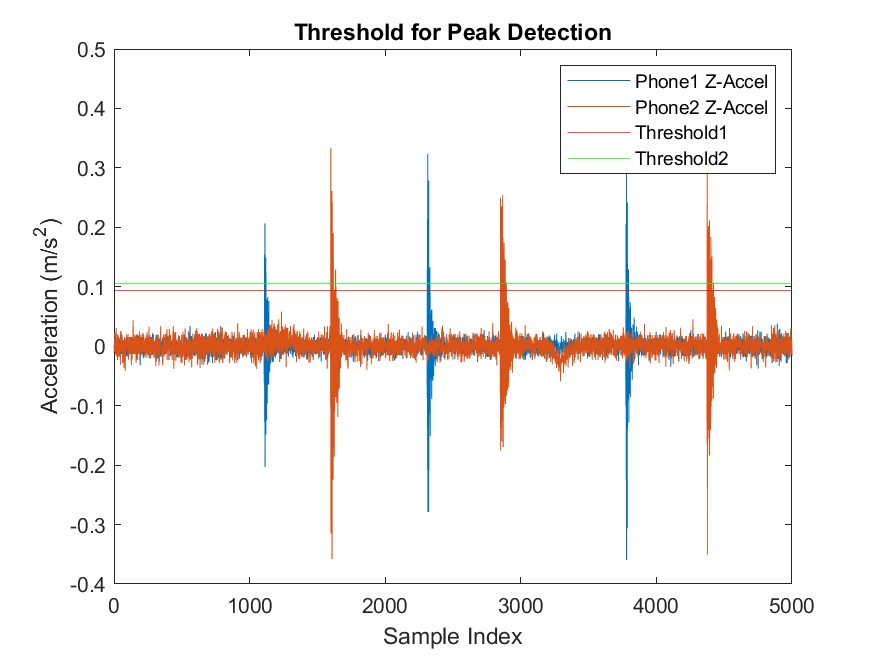
Significant impacts were identified using peak detection algorithms, where the accelerations surpassed predefined thresholds. These thresholds were set based on the maximum absolute acceleration values from each device, calculated as:
The data aquisition was done on an outside pingpong table, with a nearby road, and many people walking around, in a slight wind, so the collected data was obviously noisy and needed a threshold to filter out all the insignificant components detected.
After detecting peaks in the Z-axis data, I cross-referenced these with changes in the X and Y axes to filter out false positives and ensure that only genuine impacts were considered. This method allowed for more precise localization of the impacts on the table's surface.
1.3 Signal Resampling and Alignment
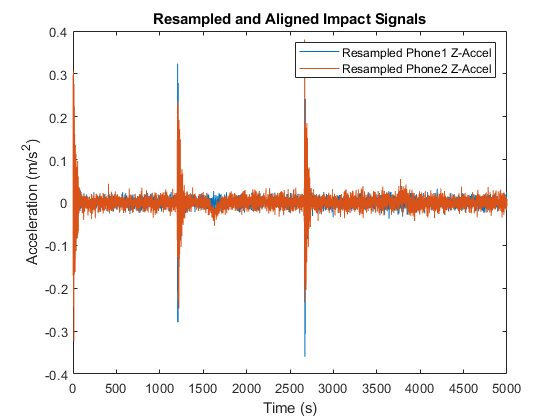
Since the two devices recorded data at slightly different sampling rates and, I resampled both signals to the lower of the two rates:
fs_min = min(fs1, fs2);
This ensured that both data sets were compatible for further comparison. The signals were aligned based on the first three detected impacts, that were specifically made for calibration purposes at an equal distance from each device, allowing me to synchronize the timing of the events. After cutting both signals at the beginning of the first peak the resampling factors were computed as:
1.4 Uncertainty Estimation Based on Direction Vector Differences
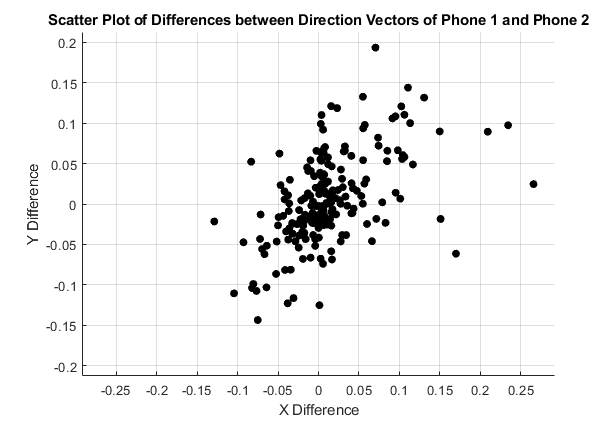
To quantify the uncertainty in the detection process, I computed the difference between the direction vectors from the two devices for each impact event. The process involved the following key steps:
Peak Detection and Alignment
The peaks in the Z-axis acceleration data were detected using a threshold-based approach. Once the peaks were identified, I aligned the signals from both devices by synchronizing the peaks. However, due to differences in the devices’ positions and accelerometer types and sampling, slight discrepancies in the detected peaks were inevitable, introducing uncertainty. Assuming that the table is a single solid object, each impact on the x and y axes should be equal in each point of the table.
Direction Vector Differences
For each detected impact, I calculated the difference between the direction vectors from the two devices. The direction vectors were derived from the acceleration data along the X, Y, and Z axes:
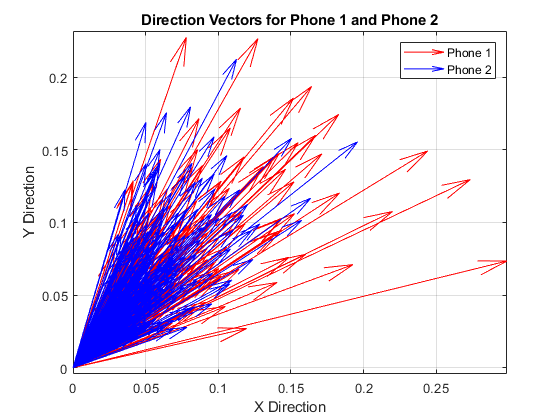
The difference between these vectors was computed as:
The magnitude of this vector difference provides an estimate of the uncertainty in the detection process. Larger differences between the vectors indicated greater uncertainty in determining the exact impact location. All differences have been calculated, and a circle large enough to contain all points has been used as an uncertanity range, equally for each direction.
2. Results
2.1 Impact Detection
The detected impacts were plotted to compare the peak locations between the two devices. This comparison helped me quantify the differences in timing between the impacts detected by each phone:
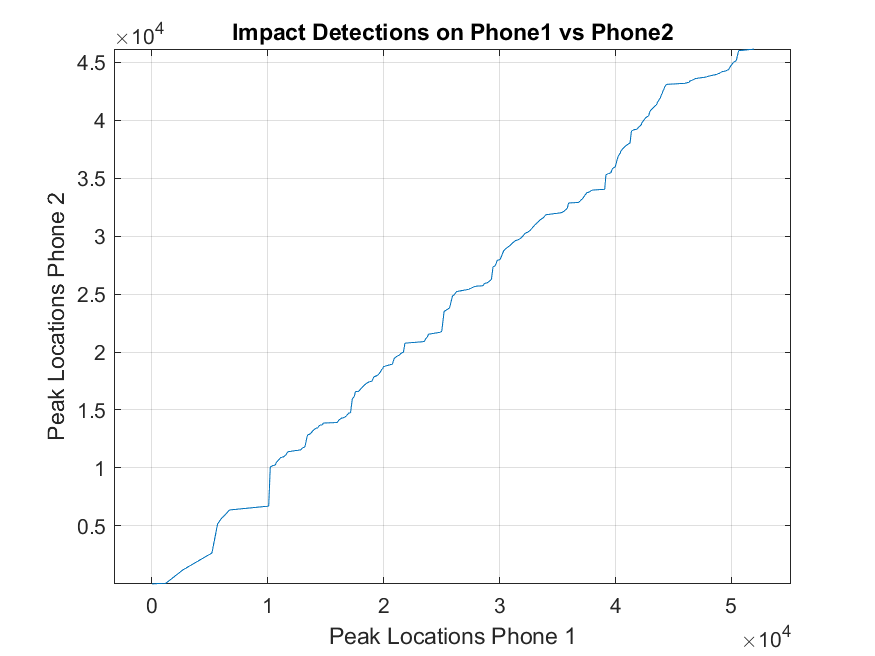
The timing differences were analyzed by computing the time difference between the detected peaks:
2.2 Ping-Pong Table Visualization
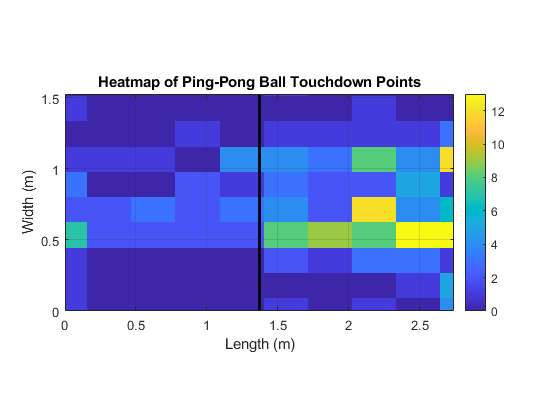
I mapped the detected impacts to a Ping-Pong table model. By normalizing the data and using both the X and Y axes, I calculated the approximate location of each impact on the table. The impact points were visualized as a heatmap, representing the distribution of impacts. A histogram was also generated to show the frequency of impacts across different areas of the table:

3. Conclusion
The combination of peak detection and signal resampling techniques proved to be effective in identifying and synchronizing impact events between the two devices. By using the X, Y, and Z acceleration data, I was able to estimate both the timing and location of impacts on the table. This method could be expanded for use in real-time game analytics or event monitoring applications.
In future work, improvements could focus on refining the detection algorithm to account for noisy data and adjusting the detection threshold to ensure a more balanced representation of impacts across the entire table surface, as more impacts were detected on the side where the devices were placed.